

Milestone Tracking
1 Gantt in Detail
The key benefits of using Gantt charts:
-
Avoid confusion – all stakeholders will have a single document outlining the work to be done, who is responsible for the work, what additional resources are needed, and when the work is to start and stop.
-
Align task relationships – task dependencies are clearly defined and tasks that are expected to be completed in parallel are identified.
-
Team member communication is facilitated – responsible personnel are readily known, so issues either anticipated or real can be discussed.
-
Critical elements are apparent – team leaders are able to identify the aspects of development that are critical due to the number of dependencies defined.
2 Redmine & Picking the Right Tools
Did you expect to see Redmine in a discussion about Gantt charts? Redmine generates Gantt Charts from issues. Think about user story tracking from CS 350. When first entering everything into Redmine (or OpenProject), your group recorded estimated time required. During CS 350 Phases 3 through 5. You assigned stories, wrote notes, reassigned stories, and assigned statuses.
Redmine is not unique (i.e., it is not the only tool that generates Gantt Charts). Take a look at each of the previously discussed issue trackers:
- Redmine
- This has been our example. (You did not skim, did you?)
- OpenProject
- Gitlab
- There is a project called GanttLab
- Github Issue/Milestone Tracker
- GanttLab is also available for GitHub.
- Wrike
- It appears this is marketed as one of Wrike’s main features.
- Jira
- Jira is similar to GitHub/GitLab. You need to setup an external tool.
3 Storytime by Kennedy & Examples
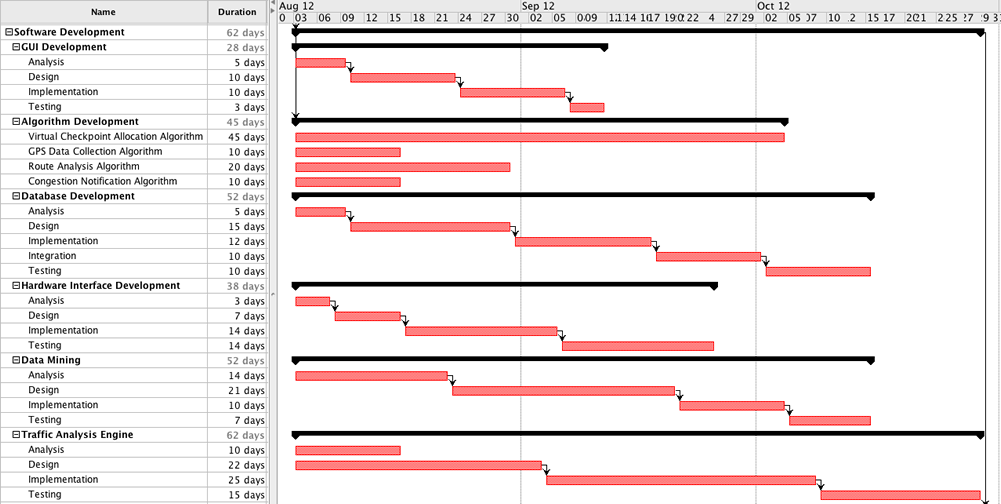
Ignoring the mandatory back-in-my-day story… we (Traffic Wizard) used to manually create Gantt Charts in Microsoft Project. Unfortunately, I am unable to open my team’s old Gantt Charts/ However, we had the foresight to take a few screenshots.
I am partial to our Phase 2 Development WBS.
4 Time to Create Gantt Charts
Each team has already prepared a top level Gantt chart for their prototype development. With http://www.gantt.com/creating-gantt-charts.htm these benefits in mind, this chart must be completed in more detail. The team member responsible for each milestone must work with their sub-team (if any) to further break the milestone into clearly identified tasks/subtasks. It is expected that all team members will access the chart to add their details.
Assignment of resources is not necessary for these tasks, as you have already identified the responsible personnel. Start and stop date is not necessary unless dependencies need to be assigned.
This chart must be consistently available (latest version) on the teams’ websites. The instructor will monitor progress weekly. The completed chart is due at the end of Module 3.
Gantt.com provides excellent tutorials. You may also refer to the lecture available in the resource component of this module.