

Debugging in IDEs
Steven Zeil
Next we turn our attention to automated debuggers.
As we have discussed earlier, there are certain common functions that we expect an automatic debugger to provide:
-
If a program crashes, the debugger will pause or freeze execution at the moment of the crash.
-
Debuggers will allow you to set breakpoints, locations in the code where you want the debugger to pause the program whenever execution hists one of those locations.
-
When you are paused, either by a crash or at a breakpoint, you can
-
examine the source code at the paused location, and the code of any functions that were called to get you there, and
-
Examine the values of variables at the moment of the pause.
-
-
When you are paused at a breakpoint, you can
-
Allow the execution to move forward in small steps.
Most debuggers will have commands allowing you to step forward to the next statement in the same function where you are paused (often called “next”), or to try and step forward to the statement but, if any other functions are being called, to stop first at the start of those functions calls (often called “step”), or to run to the end of the current function in which you are paused (often called “finish”).
Some debuggers will have other options, such as stepping from one machine-code instruction to the next, but these are not used so often.
-
Resume normal execution, running normally without stopping until the program crashes, ends normally, or until another breakpoint is hit (often called “continue”).
-
The gdb debugger provides these functions for C++, and the jdb debugger does the same for Java. The basic interfaces of these debuggers leave a bit to be desired, however, which is why we studied the emacs debugging mode as an interface to them.
Popular IDEs can also interface with gdb and jdb as well, and provide level of convenience that most programmers will prefer.
In the following sections, we’ll look at debugging java code in Eclipse and VSCode. If you find yourself needing to debug C++ code, you’ll find that working through these IDEs will be very similar.
1 The Primes Program
We will use the previously introduced Primes program as a case study for debugging.
We begin with a brief discussion on how this works, because it’s nearly impossible to debug code if you don’t know how it is supposed to work.
The heart of the program is the function isPrime:
    private boolean isPrime(int[] primes, int candidate) {     ➀
        int i = 0;
        boolean isPrime = true;
        while (isPrime && primes[i] * primes[i] < candidate) { ➂
            if (candidate % primes[i] == 0) {                  ➁
                isPrime = false;
            } else {
                ++i;
            }
        }
        return isPrime;
    }
- ➀ The parameters consist of an array of known prime numbers (in ascending order), e.g.,
[2, 3, 5, 7]and acandidatenumber that we wish to check to see if it is prime or not. - ➁ We check to see if the
candidateis prime by checking to see if it can be evenly divided by the already known prime numbers, i.e., if its modulus (%) with respect to a prime number is 0.For example, if our candidate was $15$, we would try to divide by $2$, then $3$, and in both cases the modulus/remainder would be non-zero. Then we would try dividing by $5$ and discover that $5$ divides evenly into $15$, telling us that $15$ is not prime.
- ➂ All of this is inside a loop that attempts one value from the
primesarray after another.We usually don’t need to check all of the numbers in the
primesarray. We can generally stop at the square root of thecandidate. That’s because, if there is a numberxlarger than the square root that would divide evenly into thecandidate, thencandidate / xis smaller than the square root ofcandidateand is a number that will also divide evenly intocandidate. But any number smaller than the square root will have already been checked., so we would already have stopped the loop before getting as high as thatx.
isPrime is called from `findNthPrime``:
    private int findNthPrime(int n) {
        int[] primes = new int[n-1];
        primes[0] = 2;                   ➀
        int primeCount = 1;
        int candidate = 3;               ➁
        while (primeCount < n) {
            // Check to see if the candidate is prime.
            if (isPrime(primes, candidate)) { ➃
                primes[primeCount] = candidate;
                ++primeCount;
            }
            candidate += 2;              ➂
        }
        return primes[primeCount - 1];
    }
- ➀ This initializes the
primesarray with the value $2$, the first prime number nad the only prime number that is even. - ➁ It then starts checking additional
candidates, starting with $3$, and ➂ increasing thecandidateby $2$ each time so that we only check odd numbers. - ➃ Within the loop, we call
isPrimeto see if thecandidateis prime and, if so, add it to theprimesarray.
2 Debugging in Eclipse
Eclipse includes a debugging interface that makes many debugging tasks simple.
We’ll look at two common tasks for which one might use a debugger:
- Investigating a crashed program.
- Tracking down a logic error.
Our focus on both of these will be Java programs, but debugging C++ and other programming languages is similar.
2.1 Investigating a crashed program in Eclipse.
In Java, program crashes are almost entirely indicated by the program throwing an exception, a named run-time error that causes execution of the program to halt.
Java allows programmers to write code to catch and recover from some exceptions, but we are concerned here with unexpected exceptions (for which the programmer has written no code to catch and recover).
An automatic debugger will stop execution just before an uncaught exception kills the program, presenting you with a snapshot of the execution at the moment of the crash. This snapshot wil show you:
- the line of code directly responsible for the exception, and the function within which that line of code resides,
- the function that called the function where the crash occurred,
- the function that called the function that called the function where the crash occurred, …
- … and so on, all the back to the
mainfunction that launched the program.
The debugger will not only show you all of these functions, but it will allow you to examine the values of all variables held by those functions in that moment just before the crash.
Why all this emphasis on the chain of function calls leading to the crash?
- Our goal is to locate the faulty code responsible for the crash.
- The exception/crash is just the symptom of an underlying problem.
- The actual faulty code that is the cause of that symptom usually lies elsewhere.
- Crashes often occur in lower-level code than where the actual problem occurs.
- It’s common for exceptions to be thrown from low-level code that you did not even write, code that is part of the Java standard library or even part of the operating system.
- That doesn’t mean that this lower-level code is at fault. Functions frequently crash because they were given illegal or nonsense parameters by the higher-level function that called them. And that function may have been given nonsense values by the function that called it, and so on.
Example 1: Try This: Crashes and the Eclipse Debugger
Launch the Eclipse IDE. You will probably find that your former Eclipse project is already open and waiting for you. Eclipse tends to keep projects open until you close them. (If you leave many projects open, Eclipse will take a long time to start up because it begins by recompiling all open projects.)
You should have a run configuration still set up that runs the program on an input of “5”.
Right-click on
Primes.javaand select “Run as…Java application” to run the program again.Now let’s make the program crash. We’re going to do this in a rather contrived, artificial manner, just for educational purposes.
Right-click on
Primes.javaand select “Run as…Run Configurations…”. Select the run configuration for Primes, and on the Arguments tab, change the “5” to an “x” and click “Run”.In the Console area, you will see a rather typical “Exception” message explaining that the program has crashed.
Some people tend to ignore these messages, but there’s a lot of useful information in these, so let’s look closely at this one. It should look something like
Exception in thread "main" java.lang.NumberFormatException: For input string: "x"
   at java.base/java.lang.NumberFormatException.forInputString(NumberFormatException.java:67)
   at java.base/java.lang.Integer.parseInt(Integer.java:668)
   at java.base/java.lang.Integer.parseInt(Integer.java:786)
   at cs252.Primes.main(Primes.java:25)
- The first line tells us the name/type of exception associated with this crash, a
NumberFormatException. It even tells us the text that could not be converted to a number.- The second line tells us what function the crash occurred in (
forInputString) and the file name (NumberFormatException.java) and line number (67) of the code causing the crash.Should we be concerned about the fact that this code being flagged is not actually part of our own project? Does this mean that there is something wrong with the compiler/system code installed on our system?
No! Error messages like this one tell us where a problem was detected, not the location of the **cause*. In fact, that’s what debugging is all about – finding the location of the cause after we have detected a problem.
The remaining lines fill in the information on where and how the problem was detected by telling us the call stack (a.k.a., the activation stack), the chain of calls that led us to the crash.
The third line tells us that
forInputStringwas called from the functionparseIntat line 668 inInteger.java- The fourth line tells us that
parseIntwas called from a function also namedparseIntat line 786 inInteger.java- The fifth and final line tells us that
parseIntwas called from our own functionmainin line 25 ofPrimes.java.So, if we want to hunt for the ultimate cause of this crash, we would be best off starting at line 25 of
Primes.javaand trying to figure out what input we gave toparseIntthat could have caused the crash.There’s another way to get that same information. Right-click on
Primes.javaand selectDebug as...Java Application. This launches the debugger, using our most recent run configuration.Execution runs forward until the exception/crash. At that point, the debugger stops.
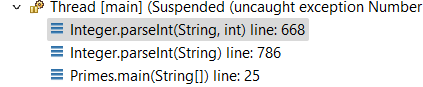
Look in the left Debug column. You should see a similar display of the call stack.
Click on each of the three function names in that display and notice how the source code displayed changes accordingly.
Click on the
Primes.mainline. The source code shows us a call toparseInt. Our code passesargs[0]to that function.We can find out what the values of
args[0]is. Look on the right and you should see a listing of the variables in the currently displayed function call. In this case, the only variable so far is the arrayargs.Click on the
>symbol to expand the array into its components. Now we can see thatargs[0]is the string “x”. Of course, it makes no sense to try to parse “x” as an integer.In the toolbar, click on the small red square to stop the debugger.
You can exit Eclipse now, or move directly to the next section.
2.2 Investigating Logic Errors in Eclipse
Investigating logic errors is, in essence, a process of working backwards from the symptom (an observed incorrect output, crash, or bad internal value) towards the cause.
The debugger aids us in this process by * letting us set breakpoints where execution will be paused to let us look at what’s going on, and * allowing us to examine the values of the program variables when our program is paused, so that we can see which ones have correct values and which ones do not.
This process often involves stopping and restarting the program multiple times, each time setting the breakpoints a little bit earlier in the computation as we try to work our way backwards towards the ultimate cause of the problem.
Example 2: Try This: Logic Errors and the Eclipse Debugger
Restart Eclipse and open your
Primesproject, if necessary.Let’s go back to a legal input. In the left column, click on the Project Explorer tab to return to our list of files. Right-click on
Primes.javaand selectDebug as...Debug Configurations.... Change the command line argument from “x” to “5” and click the “Debug” button.You should see the familiar, incorrect output suggesting that 9 is a prime number.
Let’s try to track down the reason for this mistake.
Look at the file Primes.java.
In the function
main, place a breakpoint at the line that beginsint prime = new…To do this double-click in the margin just to the left of the line number.
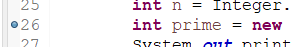
You should see a small blue circle appear, indicating that the breakpoint has been set.
Right-click on
Primes.javaand selectDebug as...Java application.This time, execution will stop at our breakpoint location.
Look in the toolbar, towards the left, and you should see a set of seven buttons
that control the debugger.
Hover your mouse over each of these to see what they do.
Because we want to see what is happening inside the function
findNthPrime, click the “Step into” button.This actually puts us into the constructor for the
Primesclass, which is not particularly interesting. So click the “Step Return” button to get back tomain, then click “Step Into” again.Now we are in the
findNthPrimefunction. There is a loop here that tries differentcandidatevalues to see if they are prime. We want to see why the program thinks that9is a prime. But the loop will check other candidates first.So let’s set another breakpoint at the line
if (isPrime(…Click the “Resume” button and execution runs forward to out new breakpoint. Look at the value of
candidateon the left. It’s smaller than what we want. Click the “Resume” button gain, and continue clicking it until we stop with acandidatevalue of 9.We might suspect that
isPrimeis giving the wrong answer when thecandidateis 9. To confirm this, click the “Step Over” button to let theisPrimecall run.You can see that we drop down into the “then” part of the if statement, meaning that
isPrimereturned true, which it certainly should not have done.The next question is, why does
isPrimereturn true for 9?In the “Debug” column, right-click on any part of the call stack and select “Terminate and Relaunch”. This restarts the program.
Use the “Resume” button until we are once again at the
if (isPrime(… line with a candidate value of 9.Now click the “Step Into” button to enter the
isPrimefunction.Here you can see a loop that tries to divide the
candidateby values taken from the arrayprimes.In the right column, examine the contents of that array. You can see that, so far, it contains 2, 3, 5, and 7, which looks good. We would expect that this loop should discover that
primes[1], which is 3, will divide evenly intocandidateand thereby show thatcandidateis not prime.Use the “Step Over” button to move forward, one line at a time, keeping an eye on the values displayed in the right column, until we exit the
whileloop.
- You should see that the function tried to divide 9 by
primes[0](2), discovers that 2 does not divide evenly into 9, and moves on.- But it exits from the loop without ever checking
primes[1](3), and therefore will falsely conclude that 9 is prime.The culprit here is the loop condition
primes[i] * primes[i] < candidate, which is intended to exit the loop when trying values larger than the square root ofcandidate. In this case, 3 is exactly the square root of 9, so we needed to check that value. The fix is to change the<to<=.Use the red “terminate” button to stop the debugger.
Make the suggested change, replacing the
<by<=.Run the program again, and this time it should correctly report that the 5th prime number is 11, not 9.
Exit from Eclipse.
3 The VSCode Debugger
Hearkening back to remote development, we can run the debugger remotely, displaying the results in a copy of the VSCode IDE running on our local PC. Unlike when working with Eclipse, we don’t need to be running X for this mode of debugging.
3.1 Investigating a crashed program in VSCode.
Again, we will see that the debugger in VSCode will halt at the moment of a crash (uncaught exception), giving us an opportunity to view the activation stack (chain of function calls) and the values held by each function at that critical moment.
Example 3: Try This: Crashes and the VSCode Debugger
On your local PC, launch VSCode and connect to
linux.cs.odu.edu.Open the folder
~/playing/vscode/primes. You should find your project still waiting for you as you left it.You should have a run configuration still set up that runs the program on an input of “5”.
Right-click on
Primes.javaand select “Run Java” to run the program again.Now let’s make the program crash. This time we’ll use a somewhat more realistic error.
Find the line of code in
findNthPrimethat saysint[] primes = new int[n];and change it to
int[] primes = new int[?*+*/n-1];Right-click on
Primes.javaand select “Run Java” and observe the crash.In the Terminal area, you will see an exception message indicating the crash. You should be able to read this clearly enough.
There are several ways to run the program within the debugger. You can use the
F5key, or right-click onPrimes.javaand select “Debug Java”, or click on the debug symbolon the left and then select the small green triangle at the top of the Run and Debug column.
Start the debugger running and let the program run till it crashes.
You should see a large notice of the exception appearing in the main editor pane.
In the Run and Debug column, expand the “Call Stack” and the
[main]thread, if necessary. Click on either function in this listing to shift the editor back and forth between the relevant locations in each function.As you do this, notice that the display in the Variables area changes accordingly.
Restore the line in
findNthPrimeback to the originalint[] primes = new int[n];Click on the Orange box button in the center top to close this execution.
You can exit VSCode now, or move directly to the next section.
3.2 Investigating Logic Errors in VSCode
Example 4: Try This: Logic Errors and the VSCode Debugger
Restart VSCode and open your
Primesproject, if necessary.Right-click on
Primes.javaand selectRun Java.You should see the familiar, incorrect output suggesting that 9 is a prime number.
Let’s try to track down the reason for this mistake.
Look at the file Primes.java.
In the function
main, place a breakpoint at the line that beginsint prime = new…To do this, single-click in the margin just to the left of the line number.
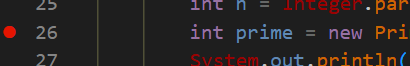
You should see a small red circle appear, indicating that the breakpoint has been set.
Use F5 or another method to launch the debugger.
Execution will stop at our breakpoint location.
Look in the center toolbar, and you should see a set of six buttons
that control the debugger.
Hover your mouse over each of these to see what they do.
Because we want to see what is happening inside the function
findNthPrime, click the “Step Into” button.This actually puts us into the constructor for the
Primesclass, which is not particularly interesting. So click the “Step Out” button to get back tomain, then click “Step Into” again.Now we are in the
findNthPrimefunction. There is a loop here that tries differentcandidatevalues to see if they are prime. We want to see why the program thinks that9is a prime. But the loop will check other candidates first.So let’s set another breakpoint at the line
if (isPrime(…Click the “Continue” button and execution runs forward to out new breakpoint. Look at the value of
candidateon the left. It’s smaller than what we want. Click the “Resume” button gain, and continue clicking it until we stop with acandidatevalue of 9.We might suspect that
isPrimeis giving the wrong answer when thecandidateis 9. To confirm this, click the “Step Over” button to let theisPrimecall run.You can see that we drop down into the “then” part of the if statement, meaning that
isPrimereturned true, which it certainly should not have done.The next question is, why does
isPrimereturn true for 9?Click on the “Restart” button to terminate the current execution and restart.
Use the “Continue” button until we are once again at the
if (isPrime(… line with a candidate value of 9.Now click the “Step Into” button to enter the
isPrimefunction.Here you can see a loop that tries to divide the
candidateby values taken from the arrayprimes.In the right column, examine the contents of that array. You can sse that, so far, it contains 2, 3, 5, and 7, which looks good. We would expect that this loop should discover that
primes[1], which is 3, will divide evenly intocandidateand thereby show thatcandidateis not prime.Use the “Step Over” button to move forward, one line at a time, keeping an eye on the values displayed in the right column, until we exit the
whileloop.
- You should see that the function tried to divide 9 by
primes[0](2), discovers that 2 does not divide evenly into 9, and moves on.- But it exits from the loop without ever checking
primes[1](3), and therefore will falsely conclude that 9 is prime.The culprit here is the loop condition
primes[i] * primes[i] < candidate, which is intended to exit the loop when trying values larger than the square root ofcandidate. In this case, 3 is exactly the square root of 9, so we needed to check that value. The fix is to change the<to<=.Use the orange “Stop” button to stop the debugger.
Make the suggested change, replacing the
<by<=.Run the program again, and this time it should correctly report that the 5th prime number is 11, not 9.
Exit from VSCode.