

 |
|
|
Abstract
In this lesson we look at a variety of code analysis tools available to the practicing software developer. These include static analysis tools that examine code without executing it, and dynamic analysis tools that monitor code while it is being run on tests or in operation.
We will look at the kinds of information that developers can obtain from these tools, the potential value offered by this information, and how such tools can be integrated into an automated build or a continuous integration setup.
Classifying Analysis Tools
Static Analysis
Dynamic Analysis
Analysis Tools and Compilers
Analysis tools, particularly static, share a great deal with compilers
Need to parse code & understand at least some language smeantics
Data flow techniques originated in compiler optimization
Most static analysis is based upon one of these graphs
That’s “graphs” in the discrete mathematics (CS 381) or data structures (CS 361) sense: a collection of nodes connected by edges, not the sense of points plotted on X-Y axes.
Abstract syntax trees
Control Flow Graphs
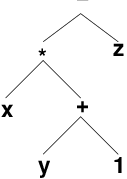
Output of a language parser
Generally viewed as a generalization of operator-applied-to-operands
Abstract Syntax Trees (cont.)
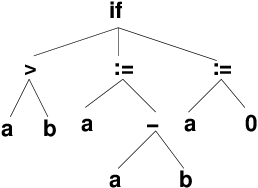
Abstract Syntax Trees (cont.)
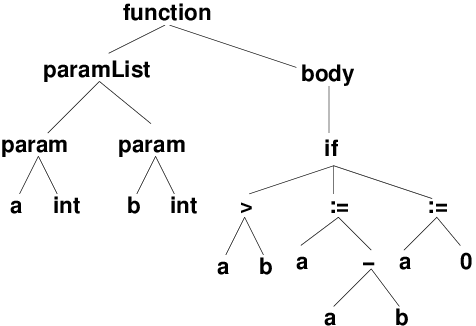
i, x) could actually refer to many different objects depending upon the scope rules of the language.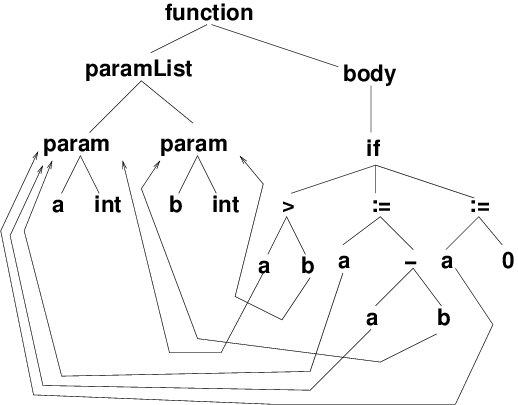
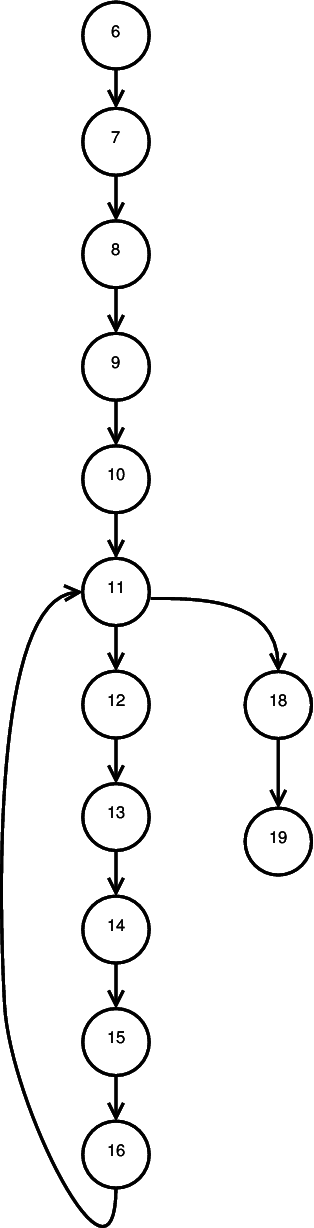
Represent each executable statement in the code as a node,
01: procedure SQRT (Q, A, B: in float;
02:                 X: out float);
03: // Compute X = square root of Q,
04: //    given that A <= X <= B
05:    X1, F1, F2, H: float;
06: begin
07:    X1 := A;
08:    X2 := B;
09:    F1 := Q - X1**2
10:    H := X2 - X1;
11:    while (ABS(H) >= 0.001) loop
12:       F2 := Q - X2**2;
13:       H := - F2 * ((X2-X1)/(F2-F1));
14:       X1 := X2;
15:       X2 := X2 + H;
16:       F1 := F2
17:    end loop;
18:    X := (X1 + X2) / 2.;
19: end SQRT;
Simplifying CFGs: Basic Blocks
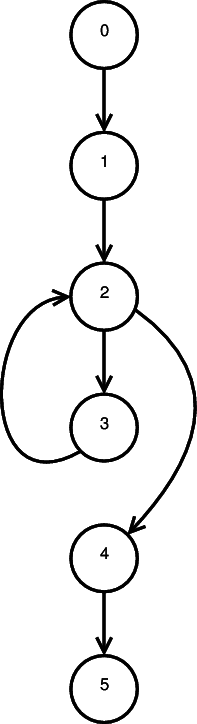
procedure SQRT (Q, A, B: in float; //  node 0
                X: out float);
// Compute X = square root of Q,
//    given that A <= X <= B
   X1, F1, F2, H: float;
begin
   X1 := A;
   X2 := B;                        // node 1
   F1 := Q - X1**2
   H := X2 - X1;
   while (ABS(H) >= 0.001) loop    // node 2
      F2 := Q - X2**2;
      H := - F2 * ((X2-X1)/(F2-F1));
      X1 := X2;                    // node 3
      X2 := X2 + H;
      F1 := F2
   end loop;
   X := (X1 + X2) / 2.;            // node 4
end SQRT;                          // node 5
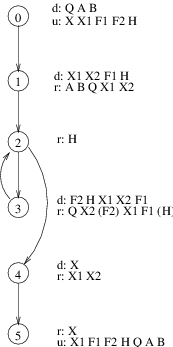
All data-flow information is obtained by propagating data flow markers through the program.
The usual markers are
di(x) : a definition of variable x (any location where x is assigned a value) at node ir<sub>i</sub>(x): a reference to x (any location where the value of x is used) at node iu<sub>i</sub>(x): an undefinition of x (any location where x becomes undefined/illegal) at node iData flow problems are solved by propagating markers around a control flow graph
Data-Flow Annotated CFG
procedure SQRT (Q, A, B: in float; //  node 0
                X: out float);
// Compute X = square root of Q,
//    given that A <= X <= B
   X1, F1, F2, H: float;
begin
   X1 := A;
   X2 := B;                        // node 1
   F1 := Q - X1**2
   H := X2 - X1;
   while (ABS(H) >= 0.001) loop    // node 2
      F2 := Q - X2**2;
      H := - F2 * ((X2-X1)/(F2-F1));
      X1 := X2;                    // node 3
      X2 := X2 + H;
      F1 := F2
   end loop;
   X := (X1 + X2) / 2.;            // node 4
end SQRT;                          // node 5
A definition di(x) reaches a node nj iff there exists a path from ni to nj on which x is neither defined nor undefined.
What definitions reach the reference to
X1in node 4?What definitions reach the reference to
Hin node 2?
The reaching definitions problem can be used to detect anomolous patterns that may reflect errors.
ur anomalies: if an undefinition of a variable reaches a reference of the same variable
dd anomalies: if a definition of a variable reaches a definition of the same variable
du anomalies: if a definition of a variable reaches an undefinition of the same variable
An expression e is available at a node n iff every path from the start of the program to n evaluates e, and iff, after the last evaluation of e on each such path, there are no subsequent definitions or undefinitions to the variables in e.
procedure SQRT (Q, A, B: in float; //  node 0
                X: out float);
// Compute X = square root of Q,
//    given that A <= X <= B
   X1, F1, F2, H: float;
begin
   X1 := A;
   X2 := B;                        // node 1
   F1 := Q - X1**2
   H := X2 - X1;
   while (ABS(H) >= 0.001) loop    // node 2
      F2 := Q - X2**2;
      H := - F2 * ((X2-X1)/(F2-F1));
      X1 := X2;                    // node 3
      X2 := X2 + H;
      F1 := F2
   end loop;
   X := (X1 + X2) / 2.;            // node 4
end SQRT;                          // node 5
Is the expression
X2 - X1available at the start of node 3?At the end of node 3?
Same questions for
Q - X2**2
A variable x is live at node n iff there exists a path starting at n along which x is used without prior redefinition.
In what nodes in H live?
In what nodes is X1 live?
What does this tell you about memory allocation within this function?
| Optimization Technique | Data-Flow Information |
|---|---|
| Constant Propagation | reach |
| Copy Propagation | reach |
| Elimination of Common Subexpressions | available |
| Dead Code Elimination | live, reach |
| Register Allocation | live |
| Anomaly Detection | reach |
| Code Motion | reach |
A common form of static analysis:
Perhaps the first such tool to be widely used, lint (1979) became a staple tool for C programmers.
Combines static analysis with style recommendations, e.g.,
data flow anomalies
potential arithmetic overflow
conditional statements with constant values
potential = versus == confusion
Is there room for lint-like tools?
lint was a response, in part, to the weak capabilities of early C compilers
Much of what lint does is now handled by optimizing compilers
However compilers seldom do cross-module or even cross-function analysis
Over time, compilers offer more and more static analysis features.
E.g., GNU g++
One caution is that these are often not turned on by default, but need to be added as command line flags.
IDEs often do not use these flags by default.
Analysis Options for g++
g++ offers several “collections” flags that turn on multiple warnings (which could have been turned on individually).
You explored these in an earlier lab.
-Wall: warnings that GNU considers “useful” and “easily avoidable”
Examples include:
-O2)char in array subscriptsprintf-Wextra: warnings that GNU considers “useful” but that can create false positives that can be hard to avoid.
Examples:
-pedantic: warnings required by ISO C++ as for non-standard code.
e.g., non-standard file extensions
-Weffc++: warnings about violations of Scott Meyer’s Effective C++
Examples:
operator= implementations that fail to return *this,checkstyle is a tool for enforcing Java coding standards.
Focus is on the more cosmetic aspects of coding, e.g.:
* imports.{ } used around even single-statement loop bodies and if-then-else bodies.Can be run via
In build.gradle:
apply plugin: 'checkstyle'
⋮
checkstyle {
    ignoreFailures = true    ➀
    showViolations = false
}
⋮
tasks.withType(Checkstyle) {   ➁
    reports {
      html.destination project.file("build/reports/checkstyle/main.html")
    }
}
checkstyleTest.enabled = false   ➂
➀ ignoreFailures determines whether the gradle build should stop when CheckStyle reports a problem.
Usually, that’s not a good idea because not all CheckStyle problems are “real” – some are “false positives”.
➁ This section specifies where the report file should be stored.
Usually this should be somewhere in build/reports/.
➂ Suppresses running CheckStyle on code in src/test/java.
Report is generated on target check.
config/checkstyle/checkstyle.xml, which is generally modified from one of these.Open source project from U.Md.
Works on compiled Java bytecode
Can be run via
Unlike Checkstyle, FindBugs goes well beyond cosmetics:
“Bugs” categorized as
Bugs are also given “priorities” (p1, p2, p3 from high to low)
In build.gradle:
apply plugin: 'findbugs'
⋮
findbugsMain {
    ignoreFailures = true
    effort = 'max'
    reportLevel = 'high'
    reports {
        xml.enabled = false
        html.enabled = true
    }
}
findbugsTest.enabled = false
Some of the settings here are similar to those for CheckStyle.
Selected checks are suppressed on selected source files by a file config/findbugs/excludeBugsFilter.xml, e.g.,
Could not open file excludeBugsFilter.xml.listingFindBugs is aging and has not been actively updated since 2015.
SpotBugs calls itself the “successor” of FindBugs.
It tracks pretty much the same kinds of bugs, and generates very similar reports, but will prbably evolve and will probably track changes in the Java language and Java commuity style more closely.
In build.gradle:
buildscript {
    repositories {
       jcenter()
       maven {
          url "https://plugins.gradle.org/m2/"  // for spotbugs
       }
    }
    dependencies {
        ⋮
       classpath "gradle.plugin.com.github.spotbugs:gradlePlugin:1.6.0"
    }
}

apply plugin: 'com.github.spotbugs'

spotbugsMain {
    ignoreFailures = true
    effort = 'max'
    reportLevel = 'medium'
    reports {
       xml.enabled = false
       html.enabled = true
    }
}

spotbugsTest.enabled = false
Another good tool for finding non-cosmetic problems in your code:
PMD, source analysis for Java, JavaScript, XSL
Can find large repeated code segments that might be better pulled out into a single function.
Works on source code
Sample reports (PMD & CPD)
Can be run via
Configured by selecting “rule set” modules
Reports provide cross reference to source location
build.gradle:
apply plugin: 'pmd'
⋮
pmd {
    ignoreFailures = true
    consoleOutput = false
}
pmdTest.enabled = false
check.Reverse engineering makes heavy use of static analysis, and is even more closely tied to compiler technology than the tools we have looked at so far.
a.k.a. “uncompilers”
Generate source code from object code
Originally clunky & more of a curiosity than usable tools
Legitimate uses include
But also great tools for plagiarism
Java and Decompilation
For example, I might write the following code:
void drawGraphics(Graphics g, Point[] pts)
{
  double xMin = pts[0].x;
  double xMax = pts[0].x;
  double yMin = pts[0].y;
  double yMax = pts[0].y;
If I compile this with the -g debugging option on (which saves variable names and other internal information so that a debugger can access them), and run any of several well-known decompilers, I would get back the same code, with only formatting changes.
If I compile this code without debugging info, one well-known decompiler would give me this:
void drawGraphics(Graphics g, Point[] pts)
{
  double d0 = pts[0].x;
  double d1 = pts[0].x;
  double d2 = pts[0].y;
  double d3 = pts[0].y;
Compiled Java .class files always preserve the API info.
Defending Against Decompilers
Work by a combination of
Renaming variables, functions, and classes to meaningless, innocuous, and very similar name sets
Stripping away debugging information (e.g., source code file names and line numbers associated with blocks of code)
Applying optimization techniques to reduce code size while also confusing the object-to-source mapping
Replacing some expressions by calls to “dummy” functions that actually simply compute the replaced expression.
Example, given the compiled code from
void drawGraphics(Graphics g, Point[] pts)
{
  double xMin = pts[0].x;
  double xMax = pts[0].x;
  double yMin = pts[0].y;
  double yMax = pts[0].y;
the obfuscator yguard will rewrite the code so that the best that a decompiler could produce is:
void a(Graphics a, Point[] b)
{
  double d0;
  double d1;
  double d2;
  double d3;
  _mthfor(d0, _mthdo(b, 0));
  _mthfor(d1, _mthdo(b, 0));
  _mthfor(d2, _mthif(b, 0));
  _mthfor(d3, _mthif(b, 0));
Not all useful analysis can be done statically
Profiling
Memory leaks, corruption, etc.
Data structure abuse
Abusing Data Structures
Traditionally, the C++ standard library does not check for common abuses such as over-filling and array or accessing non-existent elements
In a sense, the assert command of C++ and Java is the language’s own extension mechanism for such checks.
Memory Abuse
Pointer errors in C++ are both common and frustrating
Monitors can be added to help catch these
How to Catch Pointer Errors
Use fenceposts around allocated blocks of memory
Add tracking info to allocated blocks indicating location of the allocation call
Add a “freed” bit to allocated blocks that is cleared when first allocated and set when the block is freed
Memory Analysis Tools
Purify is a well-known commercial (pricey) tool
At the other end of the spectrum, LeakTracer is a small, simple, but capable open source package that I’ve used for many years
** Sample of Leaktracer Output **
Gathered 8 (8 unique) points of data.
(gdb)
Allocations: 1 / Size: 36
0x80608e6 is in NullArcableInstance::NullArcableInstance(void) (Machine.cc:40).
39      public:
40          NullArcableInstance() : ArcableInstance(new NullArcable) {}

Allocations: 1 / Size: 8
0x8055b02 is in init_types(void) (Type.cc:119).
118 void init_types() {
119 Type::Integer = new IntegerType;

Allocations: 1 / Size: 132 (new[])
0x805f4ab is in Hashtable<NativeCallable, String, false, true>::Hashtable(unsigned int) (ea/h/Hashtable.h:15).
14 Hashtable (uint _size = 32) : size(_size), count(0) {
15 table = new List<E, own> [size];
Profilers provide info on where a program is speding most of its execution time
May express measurements in
Granularity may be at level of
Measurement may be via
Profiling Tools
gprof for C/C++, part of the GNU compiler suite
jvisualm for Java, part of the Java SDK
Provides multiple monitoring tools, including both CPU and memory profiling
|
|