

(Optional) Installing a Java IDE and Compiler on your own PC
Steven Zeil
1 Local Development
We have previously looked at options for developing code remotely, where the compiler and/or the IDE ran on a remote machine. Although that is a perfectly good option for most coursework, many students prefer to do local development, where the compiler and IDE reside on their own PC. Among other things, this allows students to work while offline.
Both Eclipse and VSCode can be easily installed on your own PC. Installing your own copy of a Java compiler is slightly more complicated, but not terribly so.
Advantages:
- If you have a good PC, this is fast and responsive.
- You don’t need a good Internet connection. You may not need to be on-line at all.
Disadvantages:
- If your PC is slow, your tools will be sluggish.
- There’s software to install on your PC, taking up space on your hard drive.
- You are responsible for keeping your local copy of the compiler up-to-date.
Note that some courses deliberately use older versions of the Java compiler, partly because not all versions are supported in all operating systems.
If your compiler is a different version than the one used by the instructor, you may sometimes get very different results. It’s possible that code that compiles on your PC will not compile for the instructor, or vice versa.
-
If your operating system is different than the one used by the instructor, your compiled code may behave differently for you than it does for your instructor.
This information on local development is provided as a convenience for students wanting to explore other options. For the assignments in CS252, you must use one of the remote compiling options we have covered in the earlier lessons.
2 Installing the Compiler
If you are doing local development, install the Java Development Kit (JDK), version 11 or later.
- For Windows, get it from Oracle
- If you already have the Java Development Kit or the Java Runtime Environment (JRE) installed, consider uninstalling that before installing the new JDK. It may prevent confusion later.
- For MacOS, follow these instructions
- For Ubuntu and similar Linux distributions, do
sudo apt-get update
sudo apt-get install default-jdk
3 Installing the IDE
Recommended IDEs are Eclipse and VSCode. As of this writing, I don’t see a strong reason to favor one over the other. Pick whichever one you are more comfortable with.
- If you want Eclipse, install it from here.
- If you want VSCode, install it from here.
After installing it, run it and click on the
 button to enter the list of extensions.
- Install the
Java Extension Pack.
- Install the
4 Learn to use your IDE.
-
Choose a convenient directory (**not** your workspace directory) where you want to keep a project.
- Within that directory, create a directory named “
src/”. (It’s recommended practice to keep your Java source code in its own directory, and both IDEs will support this decision.) - Copy the files Pie.java, PieSlicer.java, and PieView.java into that
src/directory.
- Within that directory, create a directory named “
-
Now start your IDE.
4.1 If you are using Eclipse…
-
Now let’s create a project. Select “New->Project…” from the File menu or by right-clicking in the Package explorer pane on the left. Select “Java Project” and click Next.
Give your project the name “Pie”. Clear the “use default locations” box and then browse to your project directory (the one containing the
src/directory).Accept the rest of the defaults, clicking Next until you come to Finish, then click that.
A box may come up asking if you want to open the Java perspective. Click in the “Remember my decision box” and then click “Yes”. (You probably want to do this whenever you are asked about opening a new perspective).
-
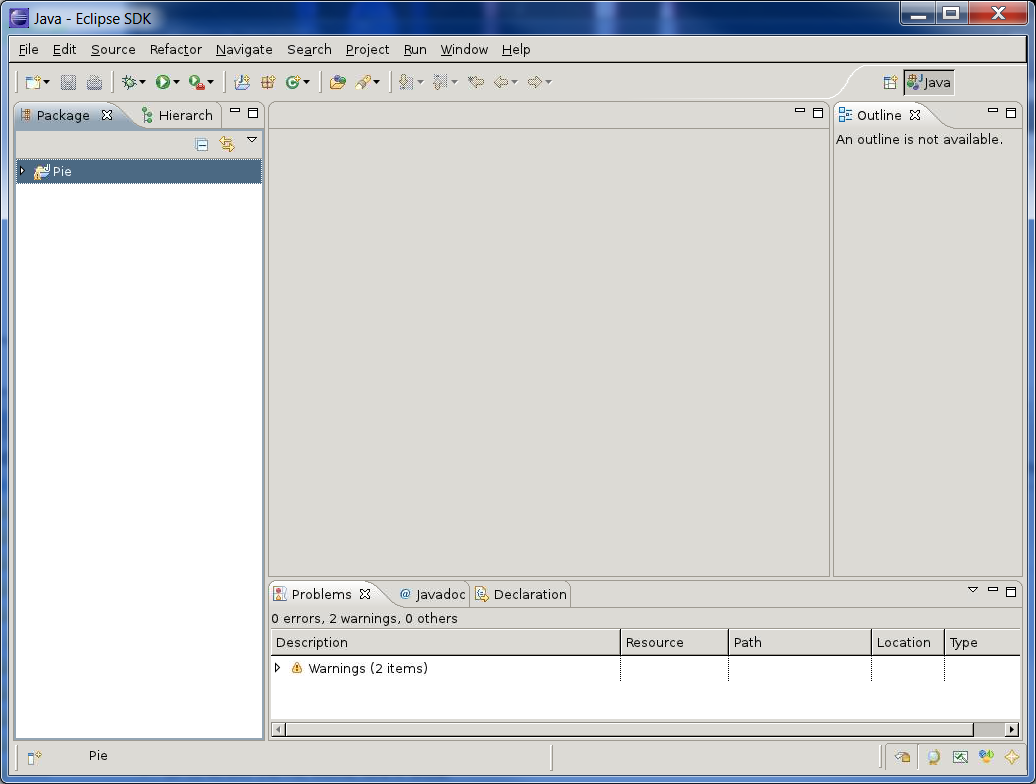
At this point, you should be looking at something like the picture on the right.
If you expand the listing, in your Package pane, you will see an entry for the “default package” and one for the system library. Expand the default package and you will see the three Java files that you had placed in the directory. Remember that, in Java, classes are organized into packages. If you don’t name a package to serve as the container, then the class is assumed to belong to the “default” package - hence its listing here in Eclipse, which organizes your code according to your package structure.
By this time, Eclipse has probably already compiled all three files. You may see a couple of warnings down in the Problems area. You can expand the Warnings item in the Problems pane to see the resulting messages. These should be some technical warnings about the lack of a serialVersionUID, which is a technicality that we really don’t need to worry about.
-
Double-click on Pie.java to open it in the editor. Let’s introduce a simple error into the code. Look for a line that mentions
Color.redand change “red” to “maroon”. A small red marker will appear to the left of this statement to indicate that an error has been detected. To the right, another red marker will appear to show roughly how far down in the file this error is located. Hover your mouse over the red marker on the left. A tip should pop up stating that “Color.maroon cannot be resolved”. In other words, the classColordoes not contain a constant named “maroon”.Of course, at this stage in your Java programming studies, you might not know what color names are provided by that class. But Eclipse can tell you. Delete the “maroon”, leaving your cursor just after the ‘.’ in that line. Hit
Ctrl-space to request help, and you will be given a list of all constants and functions provided by theColorclass that have the appropriate data type to be used here. You can scroll through the list and pick one (Don’t pick green, though.) The red error markers should disappear once you have done this.Save your changes via the File menu or via the floppy disk icon (how dated!) in the toolbar.
-
When you save, the code is actually compiled. This compilation may find errors not detected by the editor’s on-the-fly checking. If so, you will see red error markers appearing both in the editor window and in the Package browser on the left. To see this effect, move down to the
drawfunction and put a “2” after the “w” to change the name to “draw2”. This is a perfectly legal change to make, so there is no initial complaint from Eclipse. Now save the file again.Notice that a red mark appears in the Package browser next to the PieView.java. There is also now an Errors section in the Problems tab at the bottom of the page. Expand the error listing and double-click on the error message there. The editor immediately takes you to the location of that error, in PieView.java. Unsurprisingly, perhaps, the error occurs at a call to the “draw” function, which, after our change, no longer exists.
Move your mouse over the error marker to the left of the draw() call. Hovering over that location causes the error message to pop up. We’ve seen that before. But now left-click on that error marker. Eclipse actually offers suggestions on how to fix the error, And they are actually good suggestions! (How cool is that?) One suggestion is to change the call to “draw2”. The other is to add a new function named “draw” to the Pie class. Either of these is a perfectly reasonable suggestion. Choose the option to change to “draw2”. Depending on your operating system, you might select this either by using the arrow keys to highlight it and then hitting Enter, or by simply clicking on it. Eclipse makes the suggested change immediately.
The error markers disappear from the editor, although one remains by the file name in the Package browser. Save the changes made to this file, and that one goes away as well. At that time, the listing in the Problems area also disappears.
-
Try using the same technique to get rid of those two nagging warnings. Double-click on each warning message in the Problems area to go to the code location with the warning. Left-click on the yellow warning marker on the left, and select one of the actions marked with the green plus sign to correct it. Save your changes, and savor the delight of a completely empty Problems listing!
-
Now let’s run the program. The
mainfunction for this program is in PieSlicer.java. Right-click on this in the Package browser and select “Run As…” “Java Application”. You should see a small window pop up with a circle and a couple of buttons. Move your mouse around inside the circle a bit, and try the buttons. It’s nothing spectacular – just a bit of fluff for us to play with in this lab. Close the window to kill the program.You can now run the program again from the run button (usually a white triangle within a green circle) in the toolbar. Actually, because this is a simple project, you could probably have used that the first time. But what this button normally does is to remember the last program that you ran within a project. So if you have multiple “main” functions in a project, you want to use the right-click menu the first time you want to run one.
-
Let’s run the program in the debugger next. Start by opening
Pie.javaand set a breakpoint inside thePie()constructor at the line “radius = 20;”. Double-clicking just to the left of the line number will set the breakpoint.Now, right-click on
PieSlicer.java, select “Debug as…” then “Java application”. The program should start, but will pause at the line where you set the breakpoint.When it pauses, the window changes to the Debug perspective.
On the left, you can see the call stack. Expand the “main” thread, if necessary, and you will see that you are stopped in the
Pie.<init>function. Below that you can see that this was called from thePieView.<init>function, which was called fromPieSlicer.<init>, and so on. You can click on those stack entries to see where each call took place. Return to Pie when you are done.On the right, you can see the Variables area. Expand “this”. You can see all of the data members that make up our
Pieclass. -
At the top you can see a set of debugger controls, looking something like this:
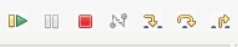
Hover your mouse over each of these to see what they do.
Click the “Step Over” control a couple of times. The code will advance. As it does, you can see the values in the Variables area changing.
Click the “Continue” control to let the program run on as normal.
-
Now let’s add a new class to the project. In the Package browser, right-click on the default package and select New…Class. A dialog box will pop up offering you a number of options for your new class. Put “Filling” in the Name box, select Generate Comments, then click Finish.
A basic class template will be set up in the editor.
Click inside the comment, at the end of the line just above the @author tag. Hit Enter and add the description “What’s the stuff inside the pie?”.
Then click on the line between the “{ }” and type
public String filling = "rhubarb";
public Pie myPie;
With the cursor positioned anywhere inside that line, you can correct the indentation with
Ctrl-I (or choose “Correct Indentation” from theSourcemenu.It’s worth taking a moment to look at the
Sourcemenu. There’s lots of options for controlling formatting and appearance of your code. You can do a quick cleanup after you have typed a lot by usingCtrl-A to select all the code in your file, then choosing Format from theSourcemenu to reformat the whole thing.You can also find some help in generating code. For example, one of the entries in the
Source menu isGenerate toString() . Later, you’ll see that I believe that almost every class should have this function, as it is extremely useful in debugging. So try selecting it, check the “Generate method comments” box, and click OK.That’s kind of nice, isn’t it? In fact, go ahead and save your changes to that file. Then return the Pie.java file, click anywhere inside the
Pieclass, and generate a toString function for this class as well. Save the result. -
Let’s do something similar for the
Pieclass. Edit Pie.java. Use theSource menu to generate a toString() function for this class. Save your file, and run the program again. Notice that the display at the top has changed. It has actually been showing the results ofPie.toString()all along. However, the defaulttoString()function isn’t all that useful. Now we have replaced it with one that,although not particularly well formatted for this application, still shows a great deal more useful information. -
While still running the program, use the buttons to change to colors of the pie segments. Note that the
toString()display changes to reflect the colors that you have selected. -
Exit Eclipse. It will save your project information so that, when you return and run Eclipse again, as long as you select the same workspace you will find your project waiting for you. (Note that, although we chose in this example to store the code for this project outside of the workspace, the workspace is still responsible for remembering that this project exists and where we keep it.)
4.2 If you are using VSCode
-
Now let’s open a project. Select “Open Folder” from the File menu. Then browse to and select your project directory (the one containing the
src/directory). -
Expand the src/ directory marker and select one of the Java files.
VSCode will open that file in the editor, and within a few seconds you should also see a “Java Projects” section appear in the left column. You can expand that area if you like. You will see that VSCode has recognized that this is a Java project with the sour ce code contained in the
srcdirectory.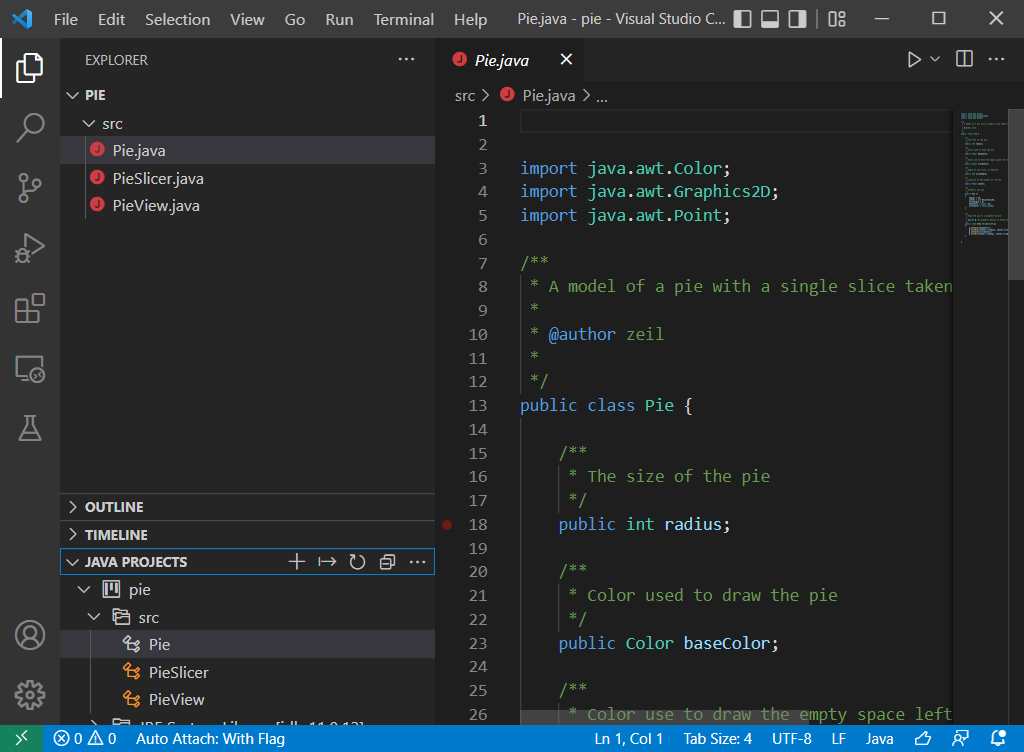
At this point, you should be looking at something like the picture on the right.
-
Click on Pie.java to open it in the editor. Let’s introduce a simple error into the code. Look for a line that mentions
Color.redand change “red” to “maroon”.The word “maroon” will be underlined in red. On the far right, a red marker will appear to show roughly how far down in the file this error is located. Hover your mouse over the underlined word. A tip should pop up stating that “Color.maroon cannot be resolved or is not a field”. In other words, the class
Colordoes not contain a constant named “maroon”.This error should also appear in a Problems area at bottom of the Window. If that is not visible, go to the View menu and click on “Problems”.
-
Of course, at this stage in your Java programming studies, you might not know what color names are provided by the
Colorclass. But VSCode can tell you. Delete the “maroon”, leaving your cursor just after the ‘.’ in that line. HitCtrl-space to request help, and you will be given a list of all constants and functions provided by theColorclass that have the appropriate data type to be used here. You can scroll through the list and pick one (Don’t pick green, though.) The red error markers should disappear once you have done this.Save your changes via the File menu or by the shortcut Ctrl-s.
-
When you save, the code is actually compiled. This compilation may find errors not detected by the editor’s on-the-fly checking. If so, you will see red error markers appearing both in the Problems listing and in the Explorer on the left. To see this effect, move down to the
drawfunction and put a “2” after the “w” to change the name to “draw2”. This is a perfectly legal change to make, so there is no initial complaint from Eclipse. Now save the file again.Notice that PieView.java is now colored red to indicate that an error has been detected there. The error is also listed in the Problems tab at the bottom of the page. Click on the error message there. The editor immediately takes you to the location of that error, in PieView.java. Unsurprisingly, perhaps, the error occurs at a call to the “draw” function, which, after our change, no longer exists.
Move your mouse over the error marker to the left of the draw() call. Hovering over that location causes the error message to pop up. We’ve seen that before. But notice that VSCode now offers a “quick fix”. Click on that or use the suggested keyboard shortcut. VSCode actually offers suggestions on how to fix the error, And they are actually good suggestions! (How cool is that?) One suggestion is to change the call to “draw2”. The other is to add a new function named “draw” to the Pie class. Either of these is a perfectly reasonable suggestion. Choose the option to change to “draw2”. Depending on your operating system, you might select this either by using the arrow keys to highlight it and then hitting Enter, or by simply clicking on it. Eclipse makes the suggested change immediately.
The error markers disappear from the editor. Save the changes made to this file.
-
Now let’s run the program. The
mainfunction for this program is in PieSlicer.java. Right-click on this in the Package browser and select “Run Java”. You should see a small window pop up with a circle and a couple of buttons. Move your mouse around inside the circle a bit, and try the buttons. It’s nothing spectacular – just a bit of fluff for us to play with as a first program. Close the window to kill the program. -
You can also run the program from the Run menu. But let’s use the debugger this time. Start by opening
Pie.javaand set a breakpoint inside thePie()constructor at the line “radius = 20;”. Clicking just to the left of the line number will set the breakpoint.Now, from the Run menu, select “Start Debugging”. The program should start, but pause at the line where oyu set the breakpoint.
When it pauses, the column on the left changes to the Debug display. (If it still shows the file listing, click on the icon of the bug crawling on the triangle.)
In there you can see the call stack. Expand the “main” thread and you will see that you are stopped in the
Pie.<init>function. Below that you can see that this was called from thePieView.<init>function, which was called fromPieSlicer.<init>, and so on. You can click on those stack entries to see where each call took place. Return to Pie when you are done.In the Variables area, expand “Local” if necessary. then expand “this”. You can see all of the data members that make up our
Pieclass. -
At the top you can see a set of debugger controls, looking something like this:

Hover your mouse over each of these to see what they do.
Click the “Step Over” control a couple of times. The code will advance. As it does, you can see the values in the Variables section of the left column changing.
Click the “Continue” control to let the program run on as normal.
-
Now let’s add a new class to the project. Click the Files icon to return to the Explorer listing in the left column. In the Java Projects area at the bottom of the column, click on the ‘+’ alongside the
src/directory to add a new java class. A box will open at the top of the window asking you what to name the class. Call it “Filling”.A basic class template will be set up in the editor.
Then click on the line between the “{ }” and type
public String filling = "rhubarb";
   public Pie myPie;
Right-click anywhere in the code and select “Format Document” to clean up your indentation.
-
Right-click again in the code and select “Source Actions”. You will be presented with a list of programming actions that VSCode can perform on your behalf. Select “Generate toString()”, clear the checkmark by
myPieand click OK.toString()is a useful function to have when debugging code. I believe that almost every class should have this function, and this is a quick and painless way to set it up.That’s kind of nice, isn’t it? Go ahead and save your changes to that file.
-
Let’s do something similar for the
Pieclass. Edit Pie.java. Use theSource menu to generate a toString() function for this class. Save your file, and run the program again. Notice that the display at the top has changed. It has actually been showing the results ofPie.toString()all along. However, the defaulttoString()function isn’t all that useful. Now we have replaced it with one that,although not particularly well formatted for this application, still shows a great deal more useful information. -
While still running the program, use the buttons to change to colors of the pie segments. Note that the
toString()display changes to reflect the colors that you have selected. -
Exit VSCode.